Key SaaS Metrics for Investors: What Do They Need to See?

You built a great product. Your team is solid. You solve a real problem. Then, you walk into a room with investors only to realize that none of it matters without the numbers to back it up. It feels like speaking a different language:
- You talk about your vision, but they ask how much it costs you to acquire each customer and what they're worth over time.
- You show them a cool feature, but they want to see how much revenue you're keeping and growing from existing users.
It's frustrating. You know your SaaS business has huge potential, but how do you prove it?
The truth is, for investors, your startup's story is written in its metrics and potential profitability. Understanding these key SaaS metrics becomes the foundation for meaningful investor conversations. A pitch deck full of promises is just a dream. On the other hand, a pitch deck with solid and well-understood metrics is a plan. In a world where over 80% of venture capital funding goes to companies that start to commercialize, understanding your numbers is not optional. It is the bridge between a great idea and a funded company.
This guide will translate that language for you. We will break down the most important SaaS metrics to track. You will learn what they are, how to calculate them, and what they say about the health of your business.
Key Takeaways
- For investors, metrics are the most reliable narrator of your company's past performance and future potential. They replace gut feelings with hard data.
- Investors primarily look at SaaS financial metrics, customer satisfaction signs, and high productivity numbers. They include recurring revenue, customer retention, profitability, user engagement, and team efficiency.
- The right metrics demonstrate a healthy and sustainable business model that is ready to grow with new investment.
- Understanding typical values for metrics like LTV to CAC ratio or Net Revenue Retention helps you frame your performance and show you are on the right track.
Boosting SaaS Startup Funding: The Critical Role of Metrics
Why do investors fixate on metrics? Because the SaaS model is unique. Unlike a business that sells a physical product once, your success depends on long-term customer relationships. Investors need to see proof that this model works for you. They need to know that the money they put in will not disappear but will generate predictable and recurring revenue over time.
Think of it from their side. They see hundreds of pitches. The ones that stand out are not those with a clever idea but those that demonstrate a deep understanding of their own business. When you present clear, logical metrics, you show them you are more than a founder — you are a CEO. You show them you have a handle on the levers of your business, which means you know:
- how to acquire customers;
- how to keep them;
- how to make money from them.
From their point of view — and quite objectively — this reduces their risk. A company that tracks its performance is a company that can manage its growth. It shows you can make smart decisions, pivot when needed, and build a scalable and profitable machine.
When you start exploring the subject of metrics, you'll find numerous things worth monitoring. The full scope can feel overwhelming, but focusing on the most impactful SaaS metrics to track keeps you aligned with what investors care about most. Below, you’ll find the 20 essential metrics that should enrich every investor-centered pitch deck.


20 SaaS Performance Metrics That Matter Most to Investors
Let's dive into the specific numbers investors want to see. We have grouped these key SaaS metrics for investors into categories to make them easier to understand.
Recurring Revenue and Growth Metrics
Recurring revenue and growth figures are among the key metrics for SaaS companies. They play a crucial role in effective SaaS marketing planning, helping investors see whether your income is stable, whether it’s increasing, and whether your customers continue to stay engaged and spend more over time.
Tracking these numbers helps you build predictable cash flow, spot areas where you need to improve, and prove that you can scale your SaaS business. For investors, strong recurring revenue is a sign that your startup isn’t just getting by — it’s on a clear path to long-term growth.
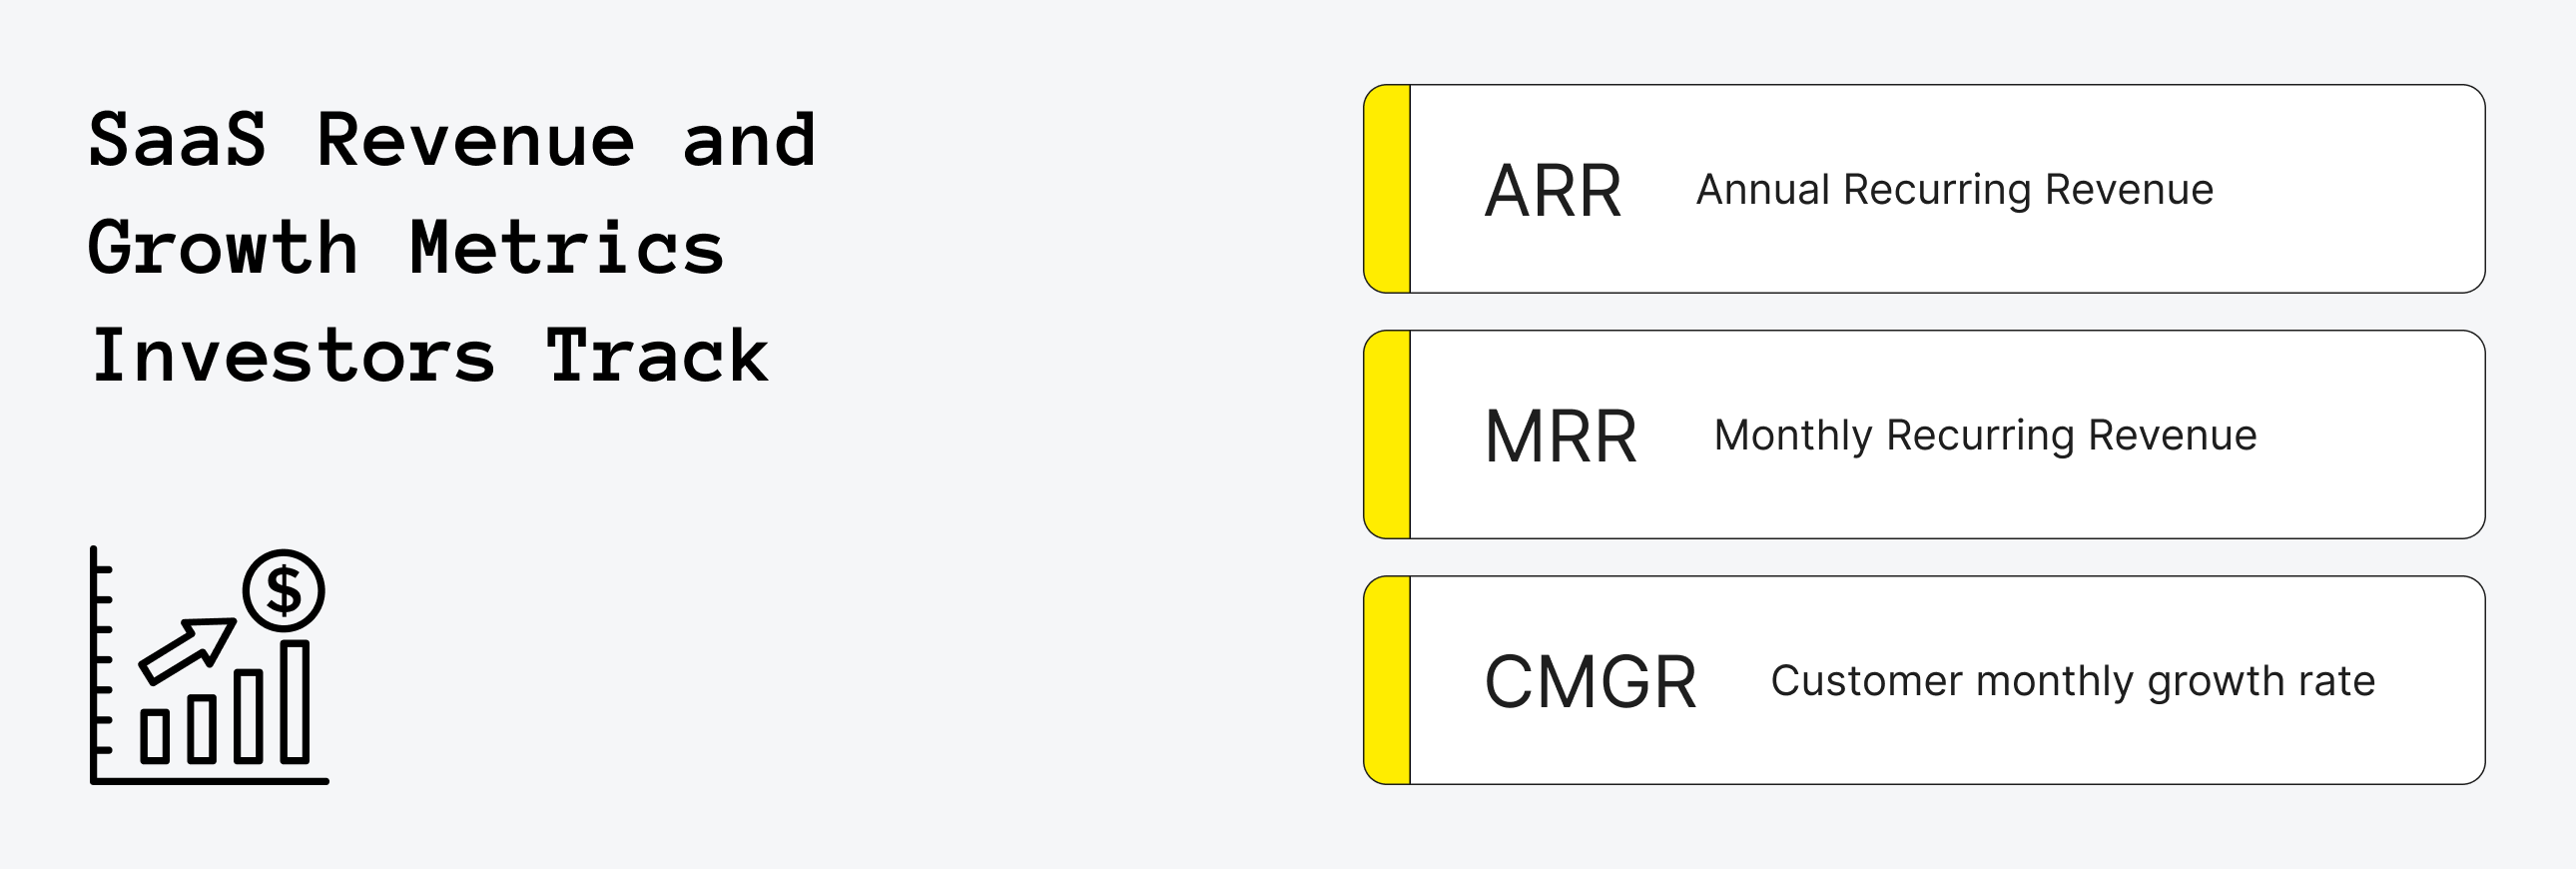
Monthly Recurring Revenue (MRR)
MRR is the predictable revenue you earn each month, the lifeblood of a SaaS company and a key indicator of health and growth.
Formula: MRR=Sum of all recurring revenue for the month
Example: If you have 100 customers paying an average of $50 per month, your MRR is $5,000. Investors want to see this number consistently increase.
It's also crucial to break down MRR growth into components: new business, expansion from existing customers, and contraction (or churn) from lost customers.
Annual Recurring Revenue (ARR)
This is the predictable revenue a business can expect in one year. It smooths out monthly fluctuations and shows the company's scale.
Formula: ARR=MRR*12
Example: If your Monthly Recurring Revenue is $15,000, your ARR is $180,000. Investors look at your ARR growth rate to understand how quickly you are scaling. A strong growth rate is a powerful signal.
For a company seeking Series A funding, investors often look for an ARR between $1 million and $2.5 million, but strong growth can be more important than the absolute number.
Customer Monthly Growth Rate (CMGR)
This shows the month-over-month percentage increase in your customer base. It demonstrates your ability to attract new business.
Formula: CMGR =((Customers at End of Month−Customers at Start of Month)/Customers at Start of Month)*100
Example: If you start the month with 200 customers and end with 220, your CMGR is 10%. A steady and high CMGR proves your marketing and sales efforts work. For an early-stage B2B SaaS, a CMGR of 10-20% is considered very strong.

Retention and Churn Metrics
Retention and churn are key SaaS startup metrics because they have a direct impact on revenue, profitability, and long-term growth. They show how happy your customers are, if your product fits the market, and how much room your business has to scale.
Keeping an eye on these numbers helps you make smarter decisions, improve customer success, and grow customer lifetime value. Strong retention also makes your company more attractive to investors and proves you can scale without relying only on costly customer acquisition.
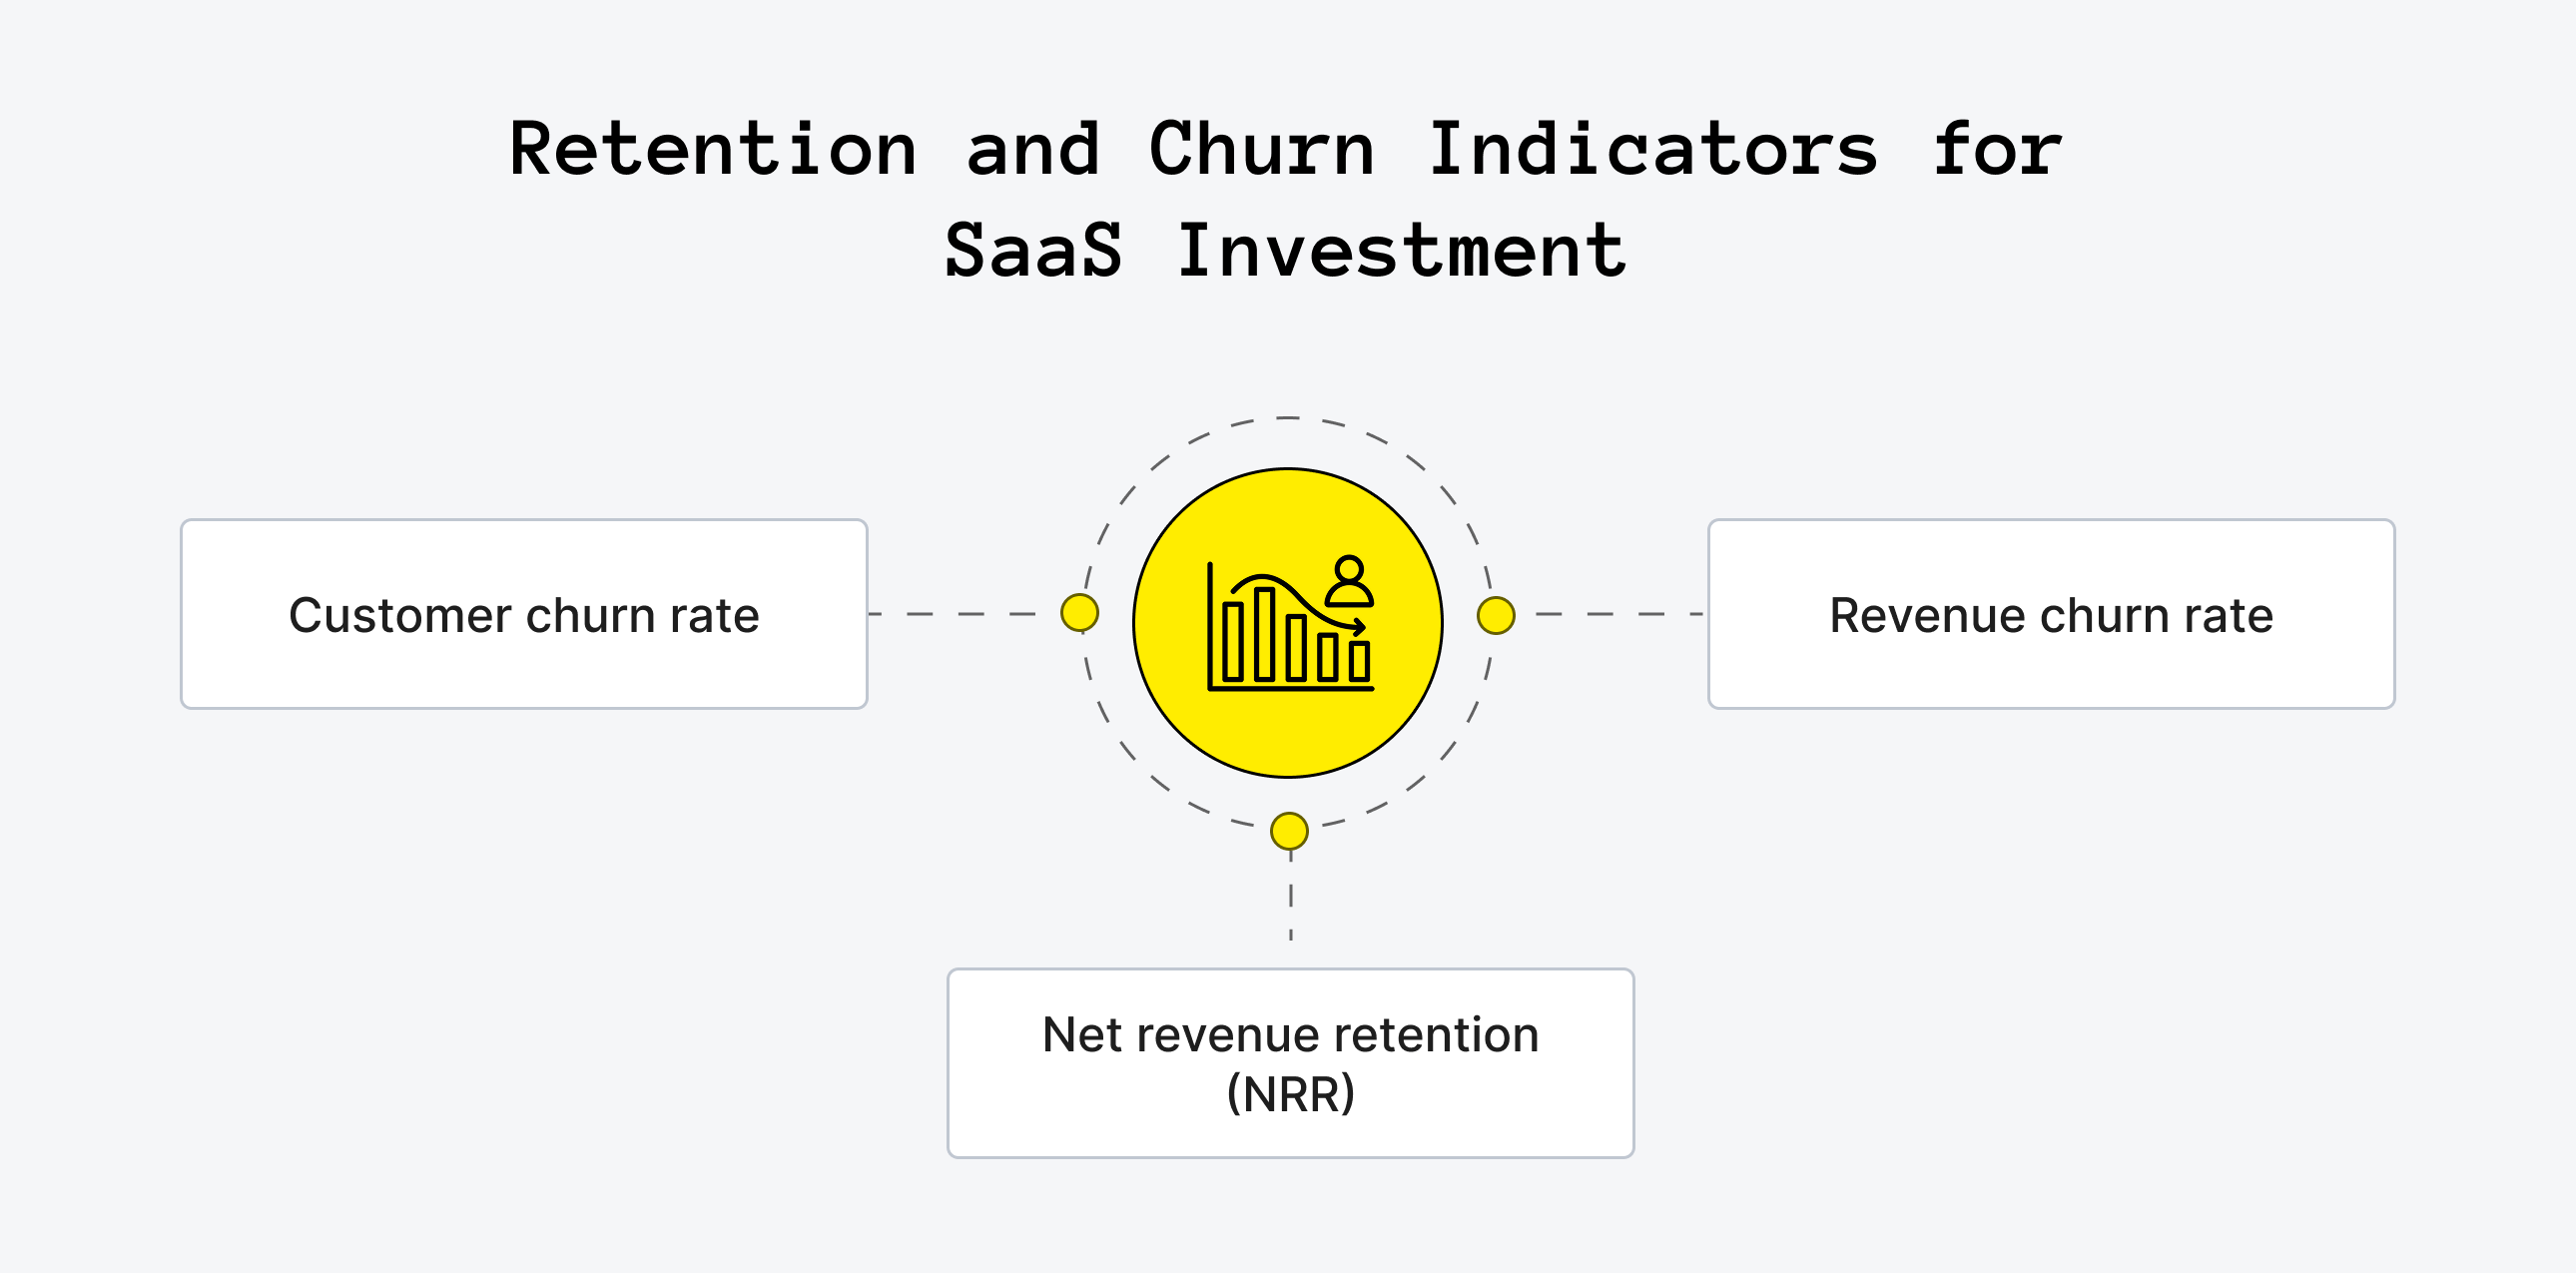
Customer Churn Rate
This is the percentage of customers who cancel their subscriptions in a given period. It's a direct measure of customer attrition.
Formula: Customer Churn Rate= (Number of Customers Lost in Period/Total Customers at Start of Period)*100
Example: If you lost 10 customers from a starting total of 200, your monthly churn is 5%. A good benchmark for early-stage SaaS is to keep this below 5-7% annually.
If your product is serving small businesses, a higher monthly churn might be acceptable, whereas for enterprise clients, churn should be below 1% monthly.
Revenue Churn Rate
Also known as MRR Churn, this measures the percentage of revenue lost from existing customers in a period. It is often more important than customer churn, as losing a high-value customer hurts more than losing a low-value one.
Formula: Revenue Churn Rate=(MRR Lost from Churned Customers in Period/MRR at Start of Period)*100
Example: If you lost $1,000 in MRR from a starting total of $50,000, your revenue churn is 2%.
This is especially critical for products with tiered pricing, as losing one enterprise customer can be more damaging than losing 20 smaller ones.
Net Revenue Retention (NRR)
This metric might be the most important one for many SaaS investors. It calculates your total recurring revenue from a group of customers, including upsells and expansion, minus any churn and downgrades.
Formula: NRR=((Starting MRR+Expansion MRR−Churn MRR)/Starting MRR)*100
Example: If you started with $100,000 MRR, added $15,000 in upgrades, and lost $5,000 to churn, your NRR is 110%. An NRR over 100% means your business grows even if you do not add new customers. This is a huge green flag for investors, with top-tier public SaaS companies often posting NRR rates above 120%.
Not sure which metrics to track?
Upsilon will gladly help you integrate an analytics system into your product.

Economic Metrics
These SaaS financial metrics focus on the profitability and sustainability of your business model. They show not only how much money you make today but also if you can keep making it in the long run.
For startups, economic metrics are especially important because they prove your model works beyond just fast growth or a big idea. They highlight how efficiently you win customers, how much value you get from them, and whether your growth can scale in a sustainable way.
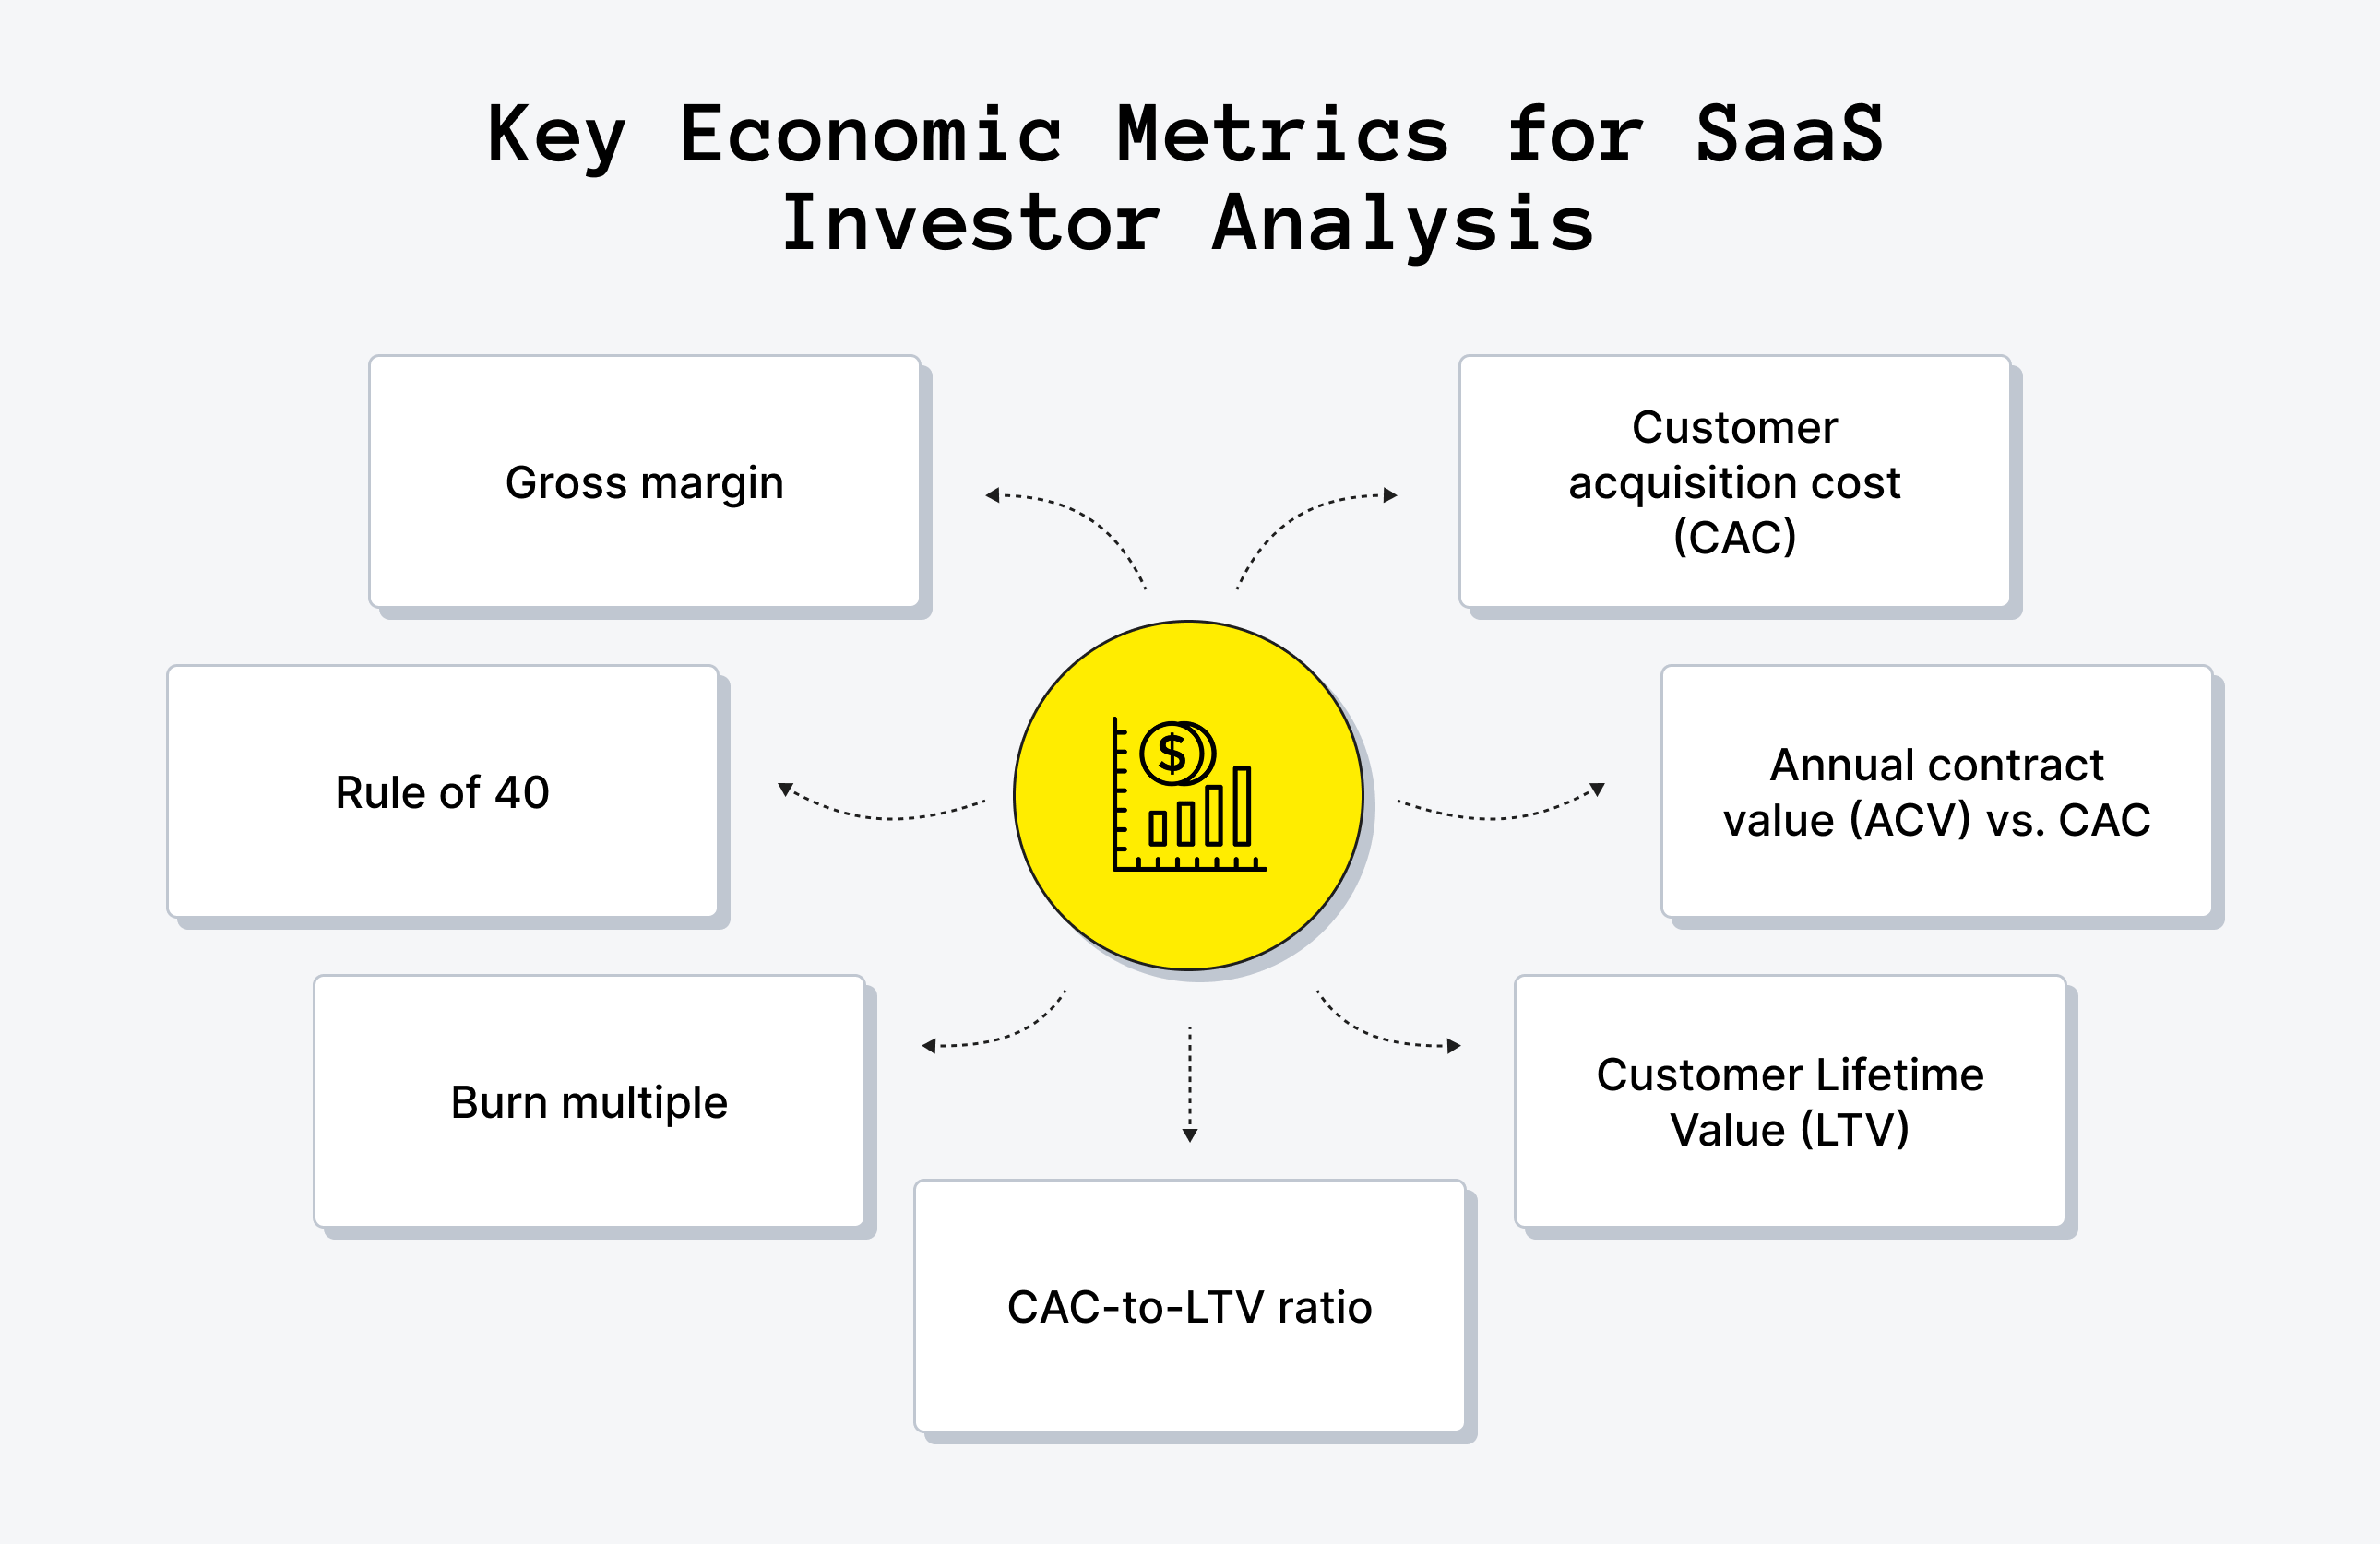
Gross Margin
This shows the percentage of revenue left after accounting for the cost of goods sold (COGS), which for SaaS includes things like hosting and support.
Formula: Gross Margin=((Total Revenue−Cost of Goods Sold)/Total Revenue)*100
Example: If your revenue is $200,000 and your COGS is $40,000, your gross margin is 80%. COGS for SaaS typically includes hosting fees from providers like AWS, third-party data services, and the salaries of your customer support team. Healthy SaaS companies typically have a gross margin of 75% or higher.
Customer Acquisition Cost (CAC)
CAC is the total cost of sales and marketing to acquire a single new customer.
Formula: CAC=(Total Sales and Marketing Spend in Period)/(Number of New Customers Acquired)
Example: If you spent $10,000 on sales and marketing and got 100 new customers, your CAC is $100. Investors want to see a low and stable CAC, and they will want to see it broken down by channel to understand which of your marketing efforts are most efficient.
Annual Contract Value (ACV) vs. CAC
ACV, one of the key SaaS metrics for investors, measures the average revenue per customer contract across a one-year period. This number makes it easy to see how much predictable income each contract brings in. Comparing ACV to your customer acquisition cost (CAC) provides a fast snapshot of the return on your acquisition spend.
Formula: ACV=Total Contract Value/Number of Years
Example: If a customer signs a 3-year deal for $30,000, the ACV is $10,000. If your CAC is $8,000, you have a healthy immediate return. A related metric here is the CAC Payback Period (how long it takes to recover the cost of acquiring a new customer through the revenue that customer brings). Investors ideally want to see you recover your CAC in under 12 months.
Customer Lifetime Value (LTV)
LTV estimates the total revenue you can expect from a single customer over the lifetime of their relationship with your company.
Formula: LTV=(Average Revenue Per Account)/(Customer Churn Rate)
Example: If your average customer pays you $2,000 per year and your annual churn is 10%, the LTV is $20,000.
Be aware that for early startup stages, LTV is a projection. Without years of churn data, it's an estimate, but investors need to see that you've thought through the long-term value of your customers.
CAC-to-LTV Ratio
This crucial ratio compares the cost of acquiring a customer to their lifetime value. It is a direct indicator of the profitability of your customer acquisition efforts.
Formula: LTV to CAC Ratio=LTV/CAC
Example: With an LTV of $20,000 and a CAC of $5,000, your ratio is 4:1. A healthy ratio is generally considered to be 3:1 or higher. However, a ratio that is too high, like 10:1, might signal to an investor that you aren't investing aggressively enough in growth.
Burn Multiple
This measures how much cash a company burns to generate each new dollar of annual recurring revenue. It is a measure of capital efficiency.
Formula: Burn Multiple=Net Burn in a Period/Net New ARR in that Period
Example: If you burned $1 million in a quarter and added $500,000 in new ARR, your burn multiple is 2x. A lower multiple is better. Venture-backed startups should aim for a burn multiple below 2x, with anything under 1.5x being excellent. A multiple over 3x can be a red flag.
Rule of 40
A popular heuristic for SaaS investors. It states that your growth rate plus your profit margin should equal or exceed 40%.
Formula: Rule of 40= ARR Growth Rate (%)+Profit Margin (%)≥40%
Example: If your ARR grows at 30% and your profit margin (often calculated using EBITDA) is 15%, your total is 45%. Since 45% is greater than 40%, you meet the Rule of 40. This demonstrates a healthy and sustainable balance between investing in growth and maintaining profitability.
While this metric is usually used for more mature companies, showing you are on a path to meet this rule demonstrates a strong grasp of financial discipline.
Engagement Metrics
This category is among the key SaaS metrics for investors because it shows how much customers truly use and rely on your product. High engagement indicates users are invested, which makes them more loyal and less likely to drop off.
When pitching to investors, it’s proof that your product isn’t just being tried — it’s becoming part of daily routines. That stickiness signals long-term potential and makes your growth story far more convincing.
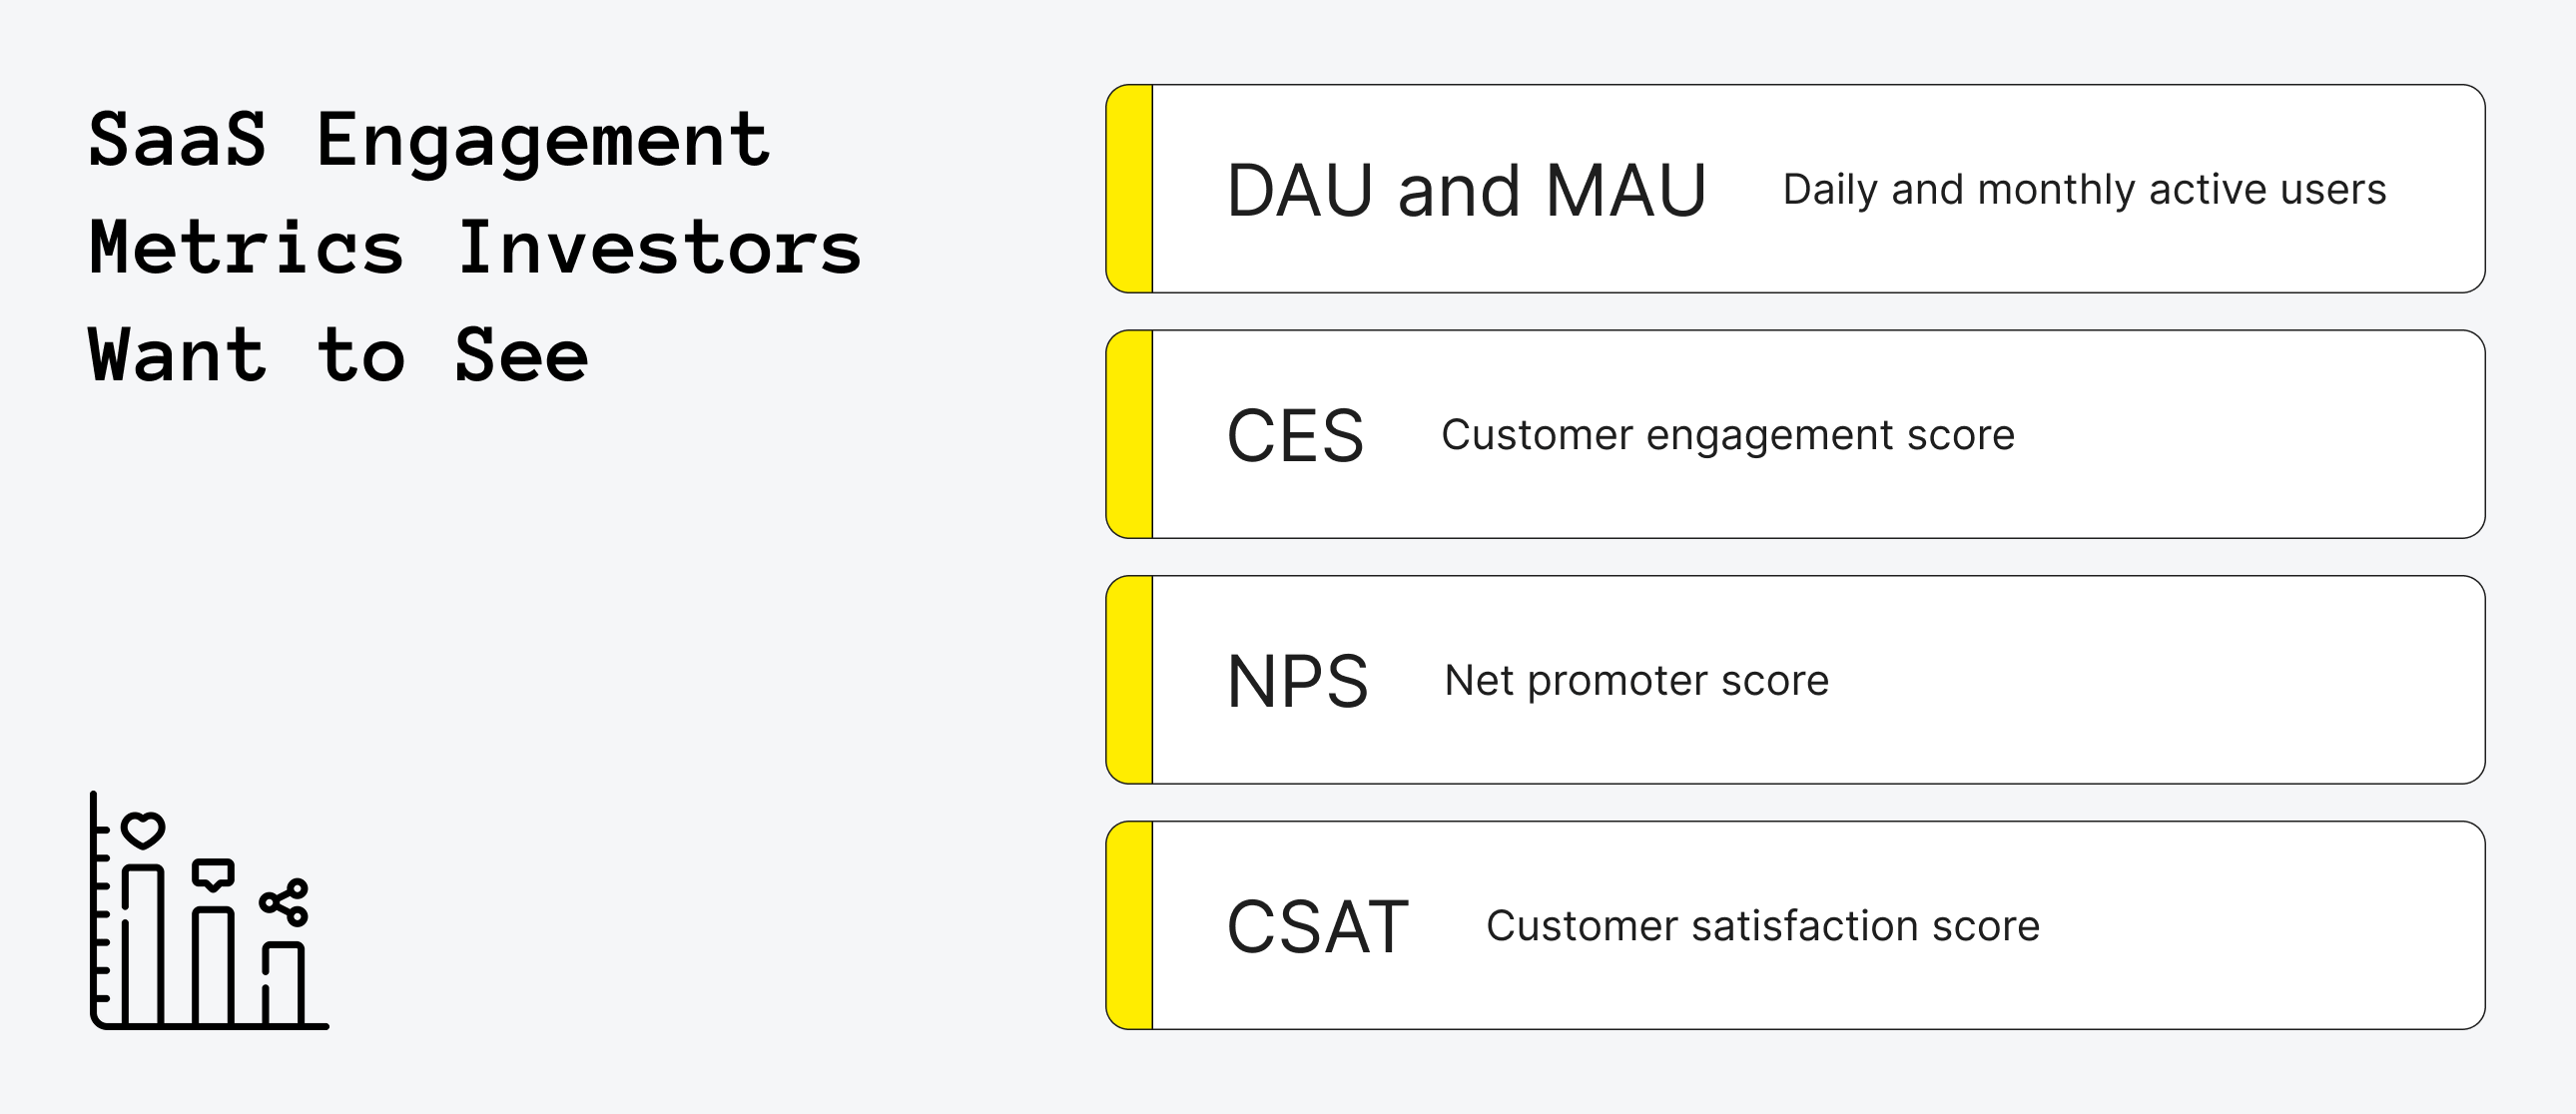
Daily and Monthly Active Users (DAU and MAU)
DAU and MAU measure how many unique users engage with your product on a daily or monthly basis. The DAU/MAU ratio shows "stickiness."
Formula: DAU/MAU Ratio=Daily Active Users/Monthly Active Users
Example: If you have 1,000 DAU and 5,000 MAU, your ratio is 20%. For many SaaS product ideas, a ratio of 20% or more is considered good.
However, you really need context here: for a collaboration tool like Slack, a high ratio is critical, but for an accounting software used mainly for month-end reporting, a lower ratio is perfectly fine.
Customer Engagement Score (CES)
This is a composite score you create by assigning point values to key actions a user can take in your product (e.g., login, create a report, invite a user).
Formula: No single formula. It's customized to your product.
Example: You might assign 1 point for a login and 10 points for creating a new project. A customer with a high score is deeply engaged and less likely to churn.
For example, a marketing automation tool might assign points for creating a campaign (10 points), importing contacts (5 points), and integrating with a CRM (20 points).
Net Promoter Score (NPS)
NPS measures customer loyalty by asking one simple question: "How likely are you to recommend our product to a friend or colleague?" on a scale of 0-10.
Formula: NPS=% of Promoters (score 9−10)−% of Detractors (score 0−6)
Example: If 60% are promoters and 20% are detractors, your NPS is +40. A positive NPS is good, and a score over 50 is excellent.
Indeed, the metric is useful, but remember that NPS measures intent, not actual behavior, so it should be analyzed alongside SaaS startup metrics like churn and engagement.
Customer Satisfaction Score (CSAT)
CSAT measures customer happiness with a specific interaction or feature, usually through a quick survey.
Formula: CSAT=(Number of Satisfied Customers /Number of Survey Responses)*100
Example: If 80 out of 100 respondents rate their experience as satisfied or very satisfied, your CSAT score is 80%.
This metric is best used to get feedback on specific touchpoints, like after a support chat closes. An industry benchmark for a good CSAT score is typically 75-85%.
Productivity and Efficiency Metrics
These SaaS performance metrics are crucial for showing how well your team and operations scale as the company grows. They highlight how effectively resources, time, and talent drive results, going beyond revenue alone. Tracking these metrics helps SaaS businesses serve more customers, launch features, and close deals without ballooning costs or team sizes.
Investors value strong product performance metrics, as they reveal if a company can scale efficiently and turn growth into lasting profitability.
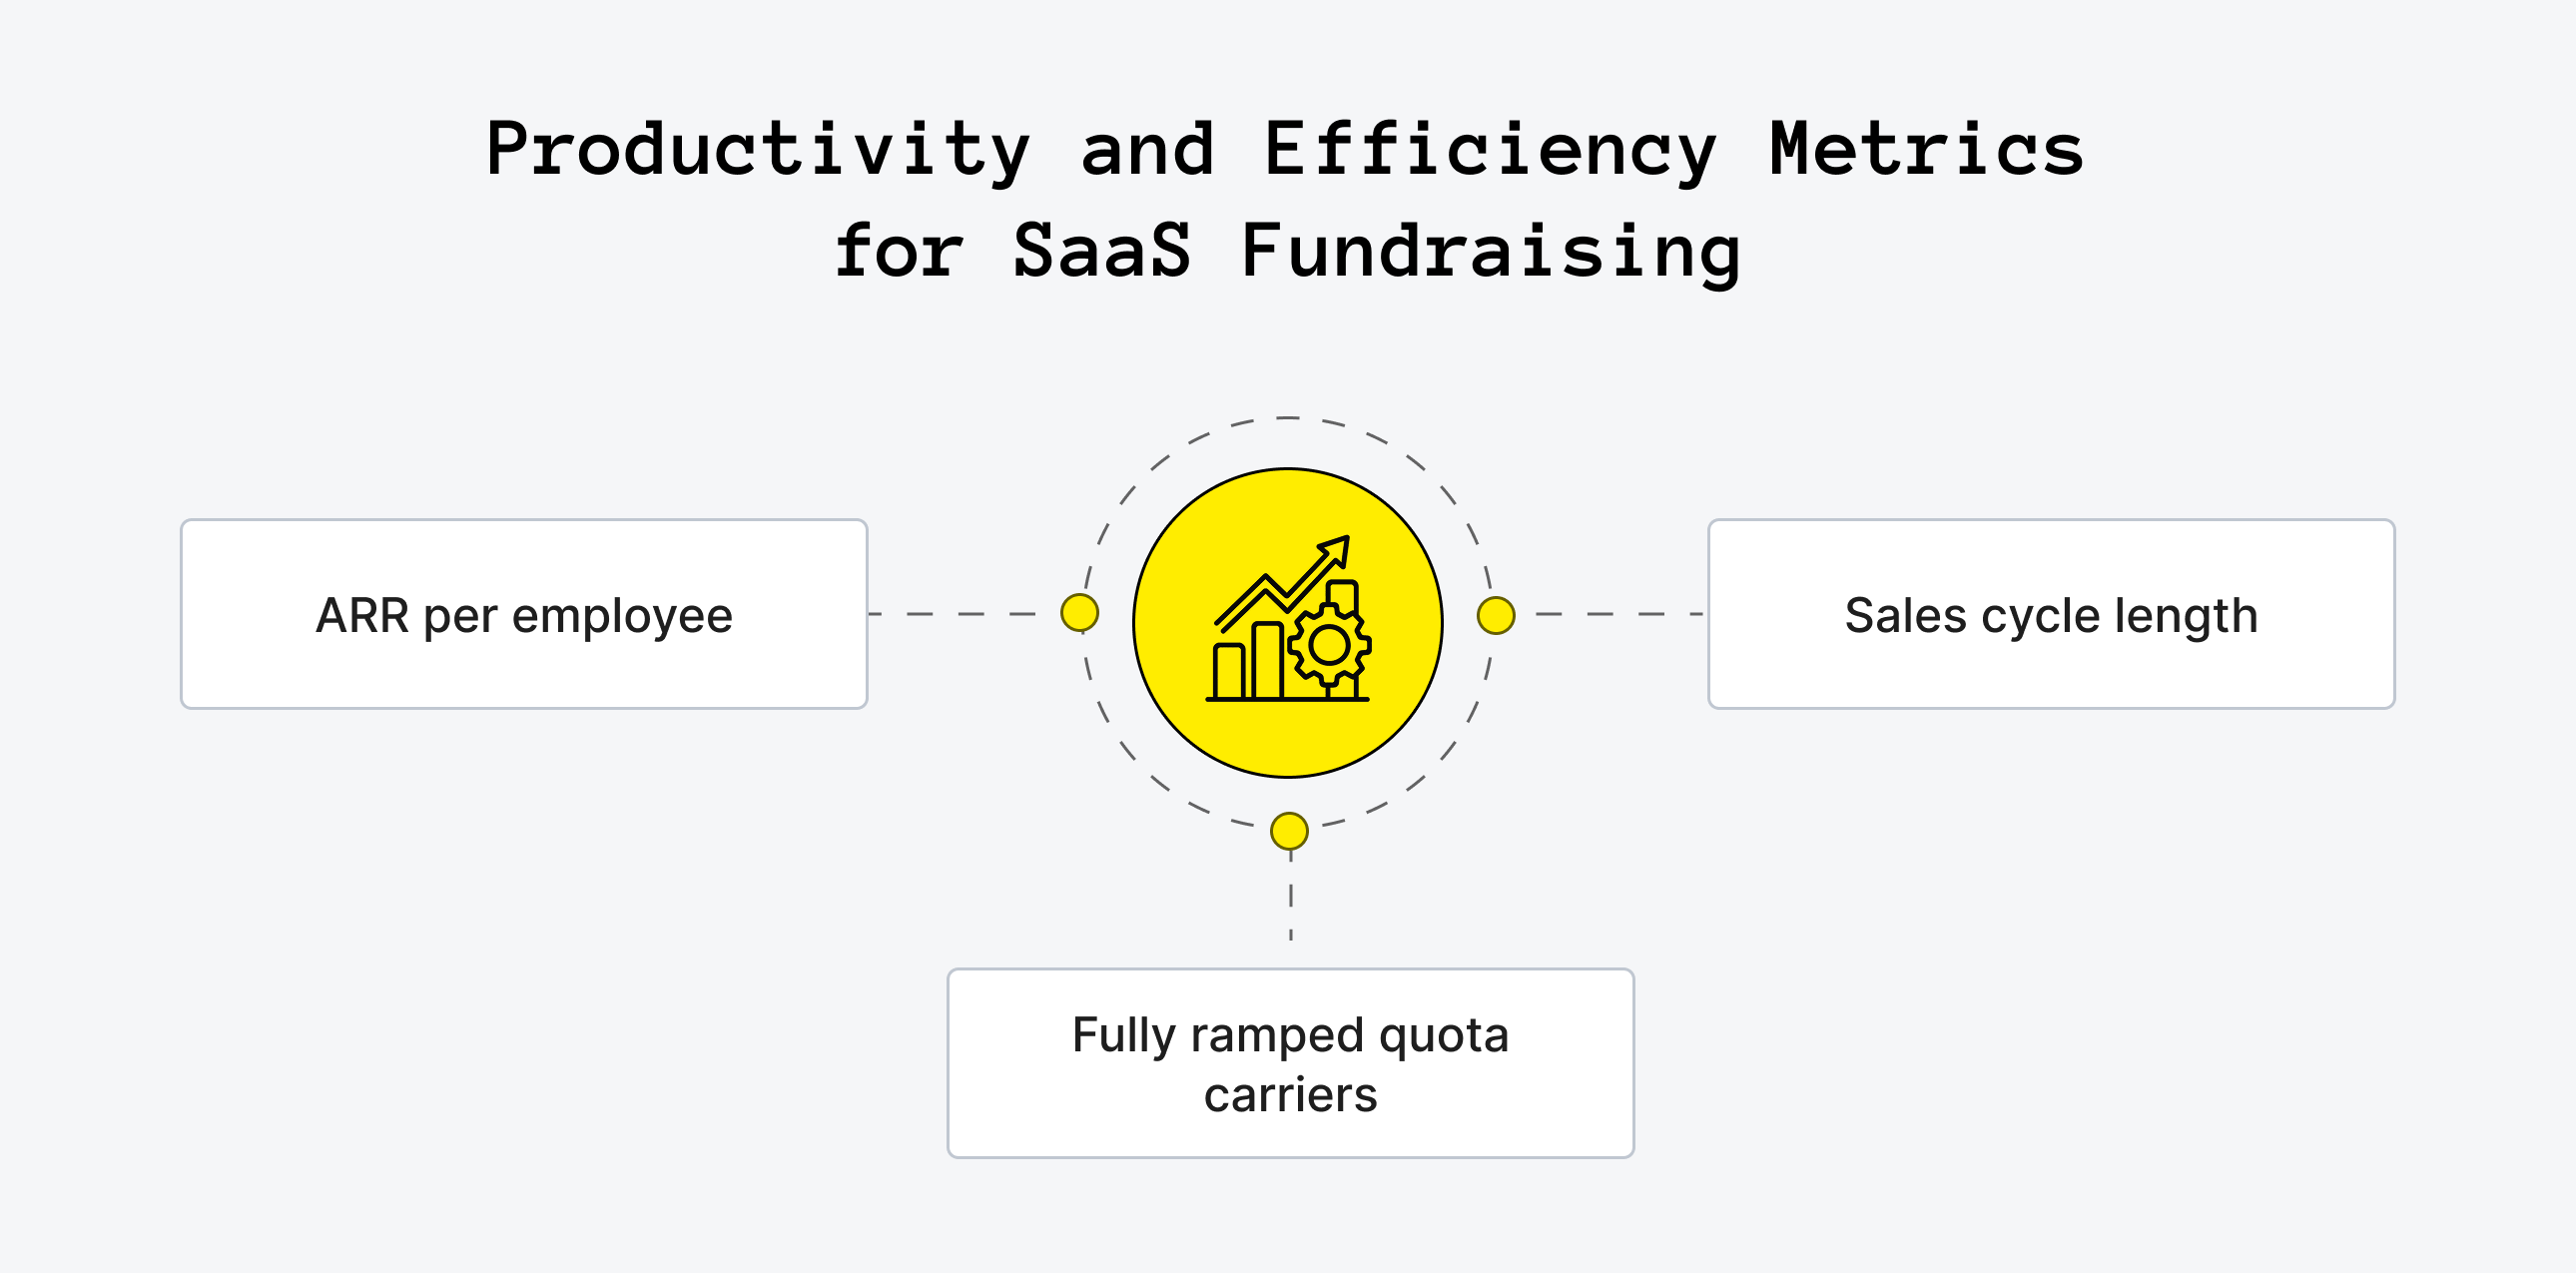
ARR per Employee
This measures the revenue generated per employee, indicating overall company productivity.
Formula: ARR per Employee=Total ARR/Total Number of Employees
Example: If your ARR is $2 million and you have 20 employees, your ARR per employee is $100,000. This number should increase over time as you scale. While this varies by stage, mature public SaaS companies often exceed $200,000 ARR per employee, so investors look for a positive trend.
Sales Cycle Length
This is the average time it takes to close a deal, from initial contact to a signed contract.
Formula: Sales Cycle Length=Total number of days to close all deals/Number of deals
Example: If you closed 3 deals that took 30, 45, and 60 days, your average sales cycle is 45 days. A shorter sales cycle means faster growth.
This metric is highly dependent on your product type. A self-serve subscription might have a cycle of a few minutes, and a complex enterprise solution could have a sales cycle of 6-9 months.
Fully Ramped Quota Carriers
This metric looks at the number of salespeople who have completed their training period and are now expected to hit their full sales quota. It helps in forecasting future sales capacity.
Formula: This is a headcount, not a formula.
Example: You might have 10 salespeople, but only 6 are "fully ramped." Investors use this to understand your true sales power and predict future growth more accurately. If your ramp time is long (e.g., 6 months), investors know that new sales hires won't contribute to revenue immediately, which impacts financial forecasts.
Need a hand with organizing your startup's analytics?
Feel free to reach out, Upsilon can assist with integrating your product's analytics system.
Concluding Thoughts on Key Metrics for Startup Investors
The key SaaS metrics for investors we've covered are more than numbers on a spreadsheet—they represent the vital signs of your SaaS business. These metrics tell the story of where you have been, how you are performing, and where your company is headed. For any investor, understanding this story builds the confidence needed to write that all-important check.
You shouldn’t wait until fundraising to start tracking these figures—make them a core part of running your business. Review your metrics regularly and learn what influences them. When you truly understand your numbers, you’re ready for investor conversations and poised to build a standout company.
If you’re unsure which SaaS startup metrics to prioritize or how to position your product for the market, explore our services for MVP development for startups or IT staff augmentation for scaling SaaS businesses. Our team makes it easier to track what matters and accelerate your path to success.
Have questions or want personalized advice? Reach out via our Contact Us page, we’re excited to see what you achieve next and look forward to supporting your startup journey.
FAQ
1. What makes a SaaS business attractive for investment?
Investors are drawn to SaaS businesses that show predictable recurring revenue, high customer retention (low churn), a scalable and profitable customer acquisition model (a good LTV to CAC ratio), and a product that customers deeply engage with. A strong team and a large market opportunity are also essential.
2. What metrics do investors look for in SaaS startups?
Investors look for a balanced dashboard of metrics for SaaS products covering growth, retention, and profitability. The most scrutinized metrics are typically Monthly Recurring Revenue (MRR) growth, Net Revenue Retention (NRR), Customer Lifetime Value (LTV) to Customer Acquisition Cost (CAC) ratio, and Gross Margin.
3. If I could only monitor three metrics with complete accuracy, which should I prioritize?
If you had to choose only three key SaaS metrics, a powerful combination would be:
- Net Revenue Retention (NRR). This single metric shows customer satisfaction, product value, and your ability to grow from your existing base. An NRR over 100% is a sign of a very healthy business.
- LTV-to-CAC Ratio. This one shows the fundamental profitability of your business model. It answers the question: "Can we acquire customers in a way that makes financial sense?"
- MRR Growth Rate. This is the primary indicator of your traction and speed in the market. Consistent and strong growth is what attracts venture capital.
4. Which specific SaaS metrics investors expect on a seed-stage pitch deck?
At the seed stage, investors understand you won't have years of data. They will focus on early signs of product-market fit and a viable business model. Key SaaS performance metrics to include are:
- Monthly Recurring Revenue (MRR). Show the current amount and, more importantly, the month-over-month growth.
- Customer count. And the growth of that number.
- Customer engagement. Early data, like DAU/MAU or results from user surveys, can show that people who use your product really like it.
- Early churn data. Even with a small sample size, it shows that you are tracking and managing customer churn.


to top

-2.png)