What Is PERT in Project Management, and How Can Startups Use It?


Launching a startup project often feels less like following a recipe and more like assembling a complex puzzle. You may know what the final picture should look like, but the order of the pieces and the time required to fit them together are not always obvious. This is exactly one of the key SaaS challenges that PERT in project management is designed to address. By breaking a project into individual tasks and estimating their duration, teams can better understand how each part connects and what sequence will lead to completion.
For startups, this structured perspective is especially useful when resources are limited and priorities change quickly. Instead of relying on rough timelines, founders can map out task dependencies and identify which steps influence the entire schedule. A simple PERT chart may include stages such as market research, product design, development, and QA testing, clearly showing which activities must happen first and which can occur at the same time.
Understanding how this method works requires looking at several key elements that shape a PERT-based plan. In this article, you'll unlock PERT key components, its formula used for time estimation, how teams implement the method in practice, and review a clear PERT chart example that illustrates the technique in action.
Key Takeaways:
- PERT helps manage uncertainty: By using optimistic, most likely, and pessimistic estimates, PERT allows teams to plan for variable task durations instead of relying on a single fixed timeline.
- Critical path and dependencies matter: Identifying task dependencies and the critical path highlights which activities directly affect the project duration and require focused attention.
- Visual planning improves clarity: PERT charts provide a structured visual of tasks, milestones, and parallel activities, making complex projects easier to coordinate and track.
- MVP development benefits from PERT: When applied during the discovery phase and early product planning, PERT helps teams create realistic timelines, stay away from potential MVP mistakes early on, and support iterative, testable releases that adapt to feedback.
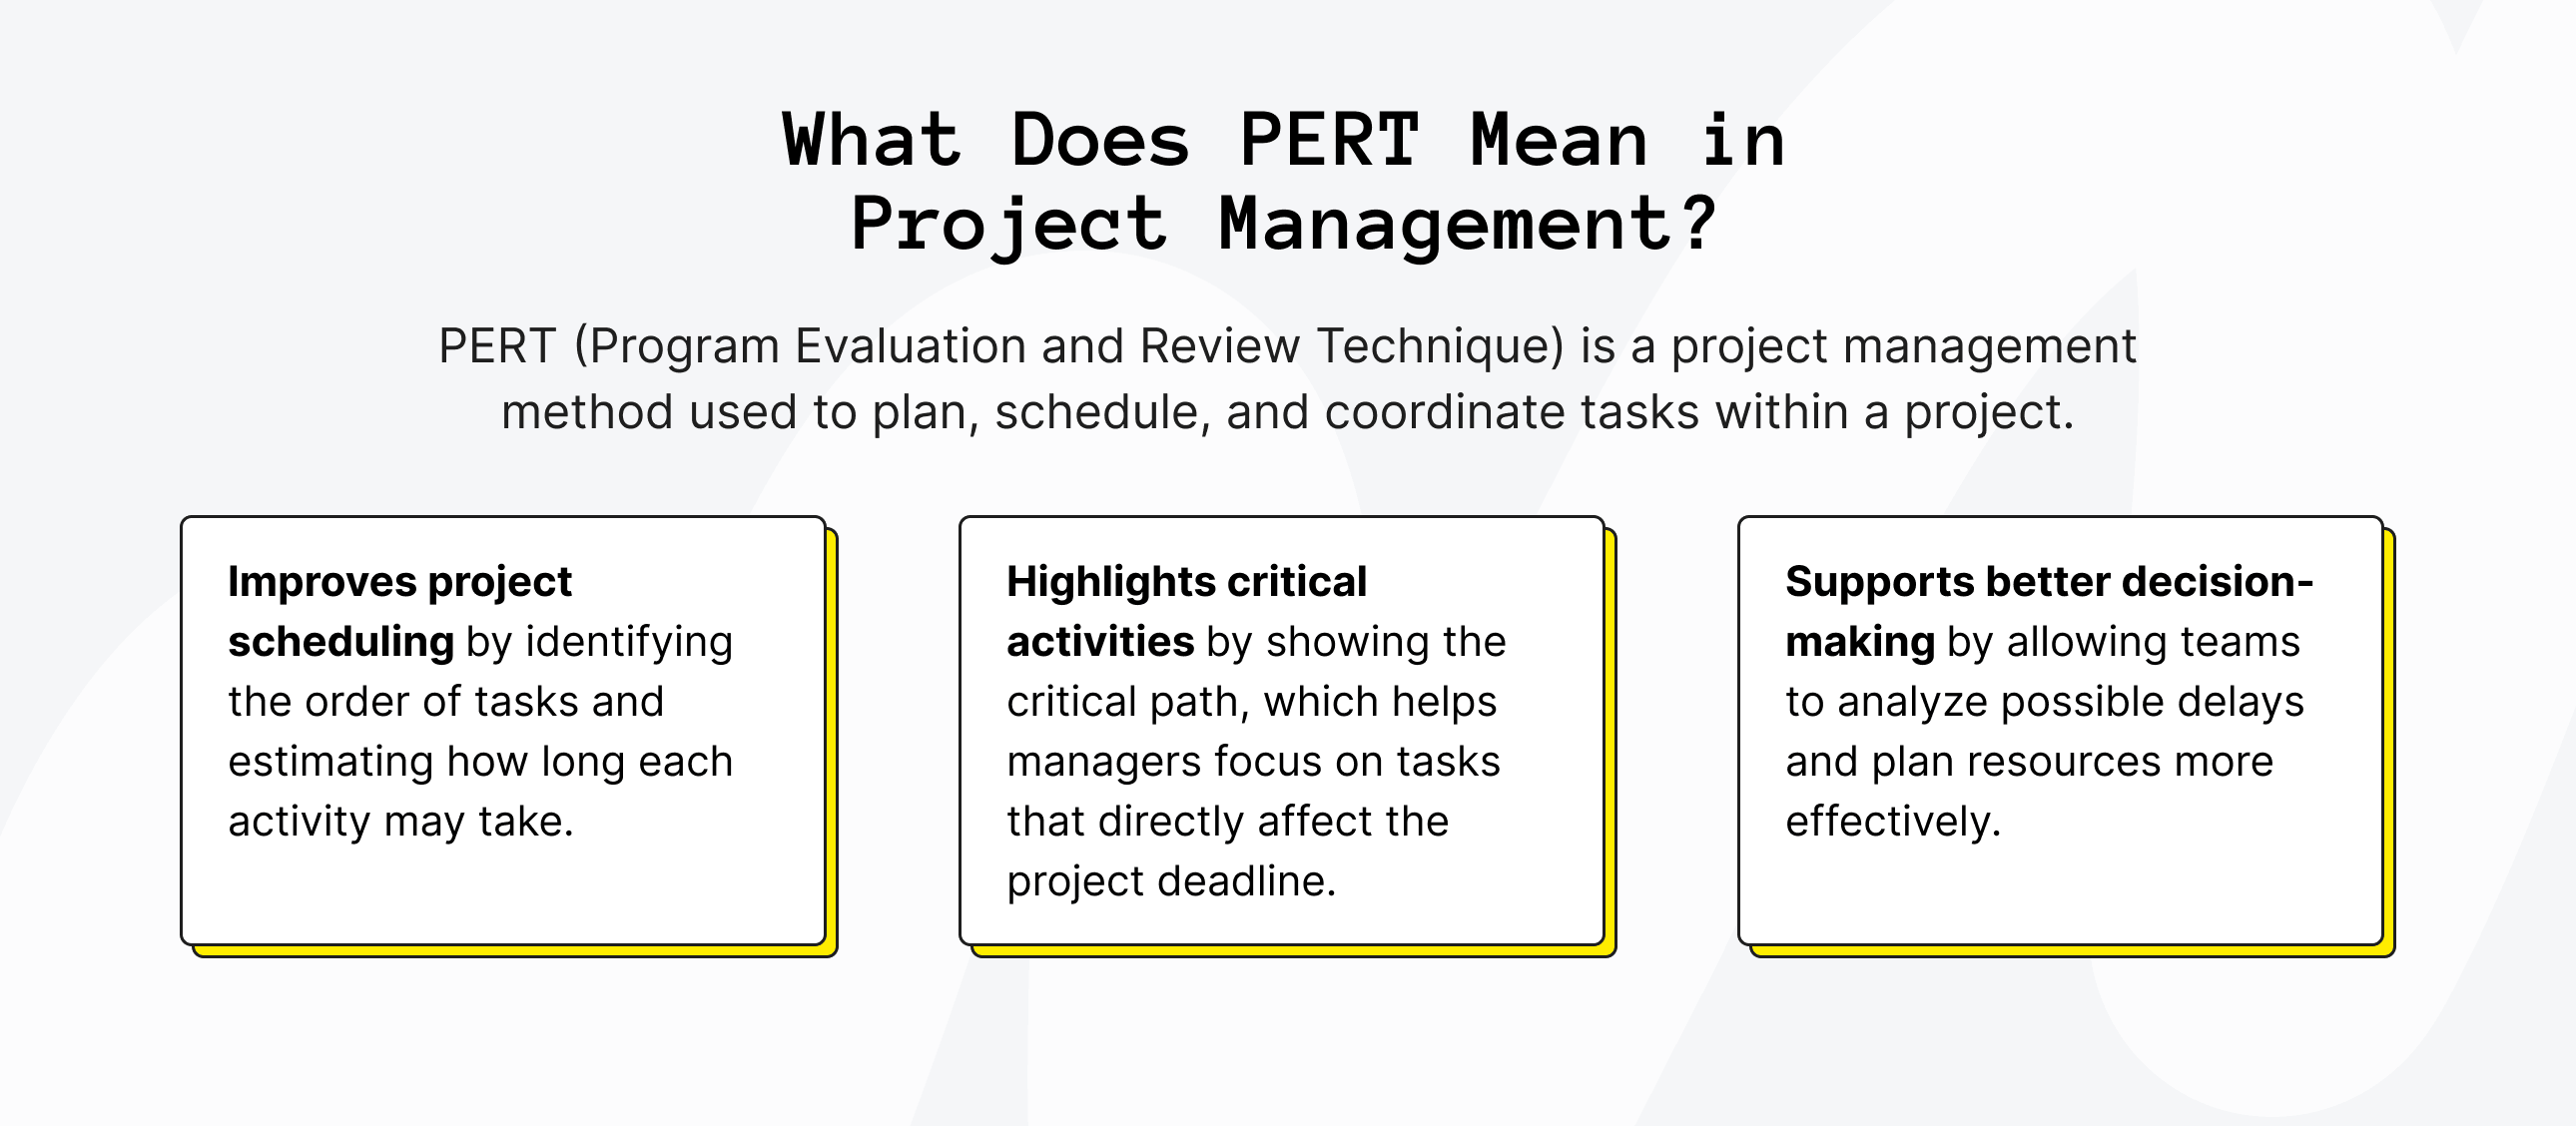
What Is PERT In Project Management and Why It Matters
So, what is PERT in project management? It is a planning technique used to organize and analyze the tasks required to complete a project. It focuses on breaking complex work into smaller activities, identifying dependencies between them, and estimating how long each step may take. Instead of relying on a single time prediction, the method considers several possible scenarios for task duration, helping teams build a more realistic project timeline.
The technique is especially useful for projects that involve many interconnected tasks. By visualizing the sequence of activities in a structured chart, teams can clearly see which steps must happen first and which can take place simultaneously. This makes it easier to coordinate work, organize resources, and maintain a clear view of how the project will progress from start to finish.
This is why the method matters in project planning. When teams understand how tasks relate to one another and how long each MVP stage may take, they can structure the workflow more logically and avoid confusion during execution. Clear task sequencing and time estimation make complex projects easier to manage and track.
Key Components of the PERT Method in Project Management
At its core, the PERT approach relies on several structural elements that help teams organize complex projects and estimate timelines more realistically. Let’s take a closer look at the primary components that define how tasks are structured, how time is evaluated, and how the overall project schedule is determined within PERT in project management.
1. Events and Activities
Events represent key checkpoints in a project timeline, marking the moment when a specific stage begins or ends. They do not involve work themselves but indicate that an important step has been completed. Activities, on the other hand, are the actual tasks performed between those events.
For example, during the product development cycle, completing the prototype may represent an event. The activities leading to that point could include designing components, assembling the prototype, and conducting initial tests. By separating events from activities, teams can clearly track both progress and workflow.
2. Time Estimates
Another essential element of the method is evaluating how long each activity might take. Instead of relying on a single estimate, PERT estimation uses three time scenarios to reflect uncertainty in project planning.
- Optimistic time (O) represents the shortest possible duration for completing a task when everything proceeds smoothly.
- Most likely time (M) reflects the expected timeframe under normal working conditions with typical challenges and delays.
- Pessimistic time (P) represents the longest reasonable duration if complications arise, such as additional revisions, limited resources, or unexpected obstacles.
Using these three values allows project planners to calculate a more balanced estimate for each task rather than relying on a single guess.
3. Dependencies and Critical Path
The final structural component focuses on how tasks are connected. Dependencies describe relationships between activities, indicating which tasks must be completed before others can begin. Many projects involve chains of dependent activities that shape the overall workflow.
Within these connections lies the critical path, the sequence of tasks that determines the minimum time required to complete the entire project. Because these activities are directly tied to the project timeline, any delay within this chain immediately affects the final delivery date. Identifying the critical path helps teams understand where scheduling precision matters most.
4. Slack Time
Slack time is how long a task can be delayed without changing the final project deadline. When tasks have more slack, your schedule is more flexible and can better handle risks or small delays.
In practice, slack time is usually measured in days or weeks and shows how long a task can wait before it starts to affect dependent work or the project end date. Planning for slack helps you prioritize tasks, reduce bottlenecks, and deal with unexpected changes without throwing the whole project off track.


The PERT Formula in Project Management
The core of the PERT method is a simple formula used to calculate the expected duration of a task based on three time estimates. Instead of relying on a single guess, the formula combines optimistic, most likely, and pessimistic scenarios to produce a more balanced estimate.
PERT Estimation Formula:
TE = (O + 4M + P) / 6
Where:
- TE = A reasonable estimate of how long a task will take to complete
- O = Optimistic time (the shortest possible duration)
- M = Most likely time (the most realistic estimate)
- P = Pessimistic time (the longest expected duration)
This formula places the greatest weight on the most likely scenario while still accounting for best-case and worst-case possibilities.
To make it clearer, let’s break it down with a simple PERT example. Imagine a team estimating the time required to complete a product prototype. They identify three possible durations:
- Optimistic time: 4 days (the design is approved immediately, there’s no scope creep, and developers stay fully focused)
- Most likely time: 6 days (there’s the usual back-and-forth with stakeholders, a few revisions, and a normal development pace)
- Pessimistic time: 10 days (stakeholders can’t align, major technical issues pop up, and the team composition changes)
Applying the PERT formula:
TE = (4 + 4×6 + 10) / 6 = 38 / 6 ≈ 6.3 days
Instead of committing to the ultra-optimistic 4 days and inevitably disappointing everyone, the team can safely round this to about 7 days and set expectations they can actually meet.
This gives a more realistic estimate than just picking one number. Instead of guessing between best‑ and worst‑case scenarios, the team gets a calculated timeframe that better reflects the uncertainty of the project.
Looking for a reliable tech partner?
Upsilon can help you develop your MVP that'll grow to be a success!

How to Implement PERT for Estimating Your Project in 5 Steps
Figuring out how long a project will really take isn’t a walk in the park, especially when tasks depend on each other. PERT gives you a practical way to break down work into smaller steps, consider different time scenarios, and see how everything connects. Here, we’ll walk you through 5 simple steps to implement this approach for estimating your project.
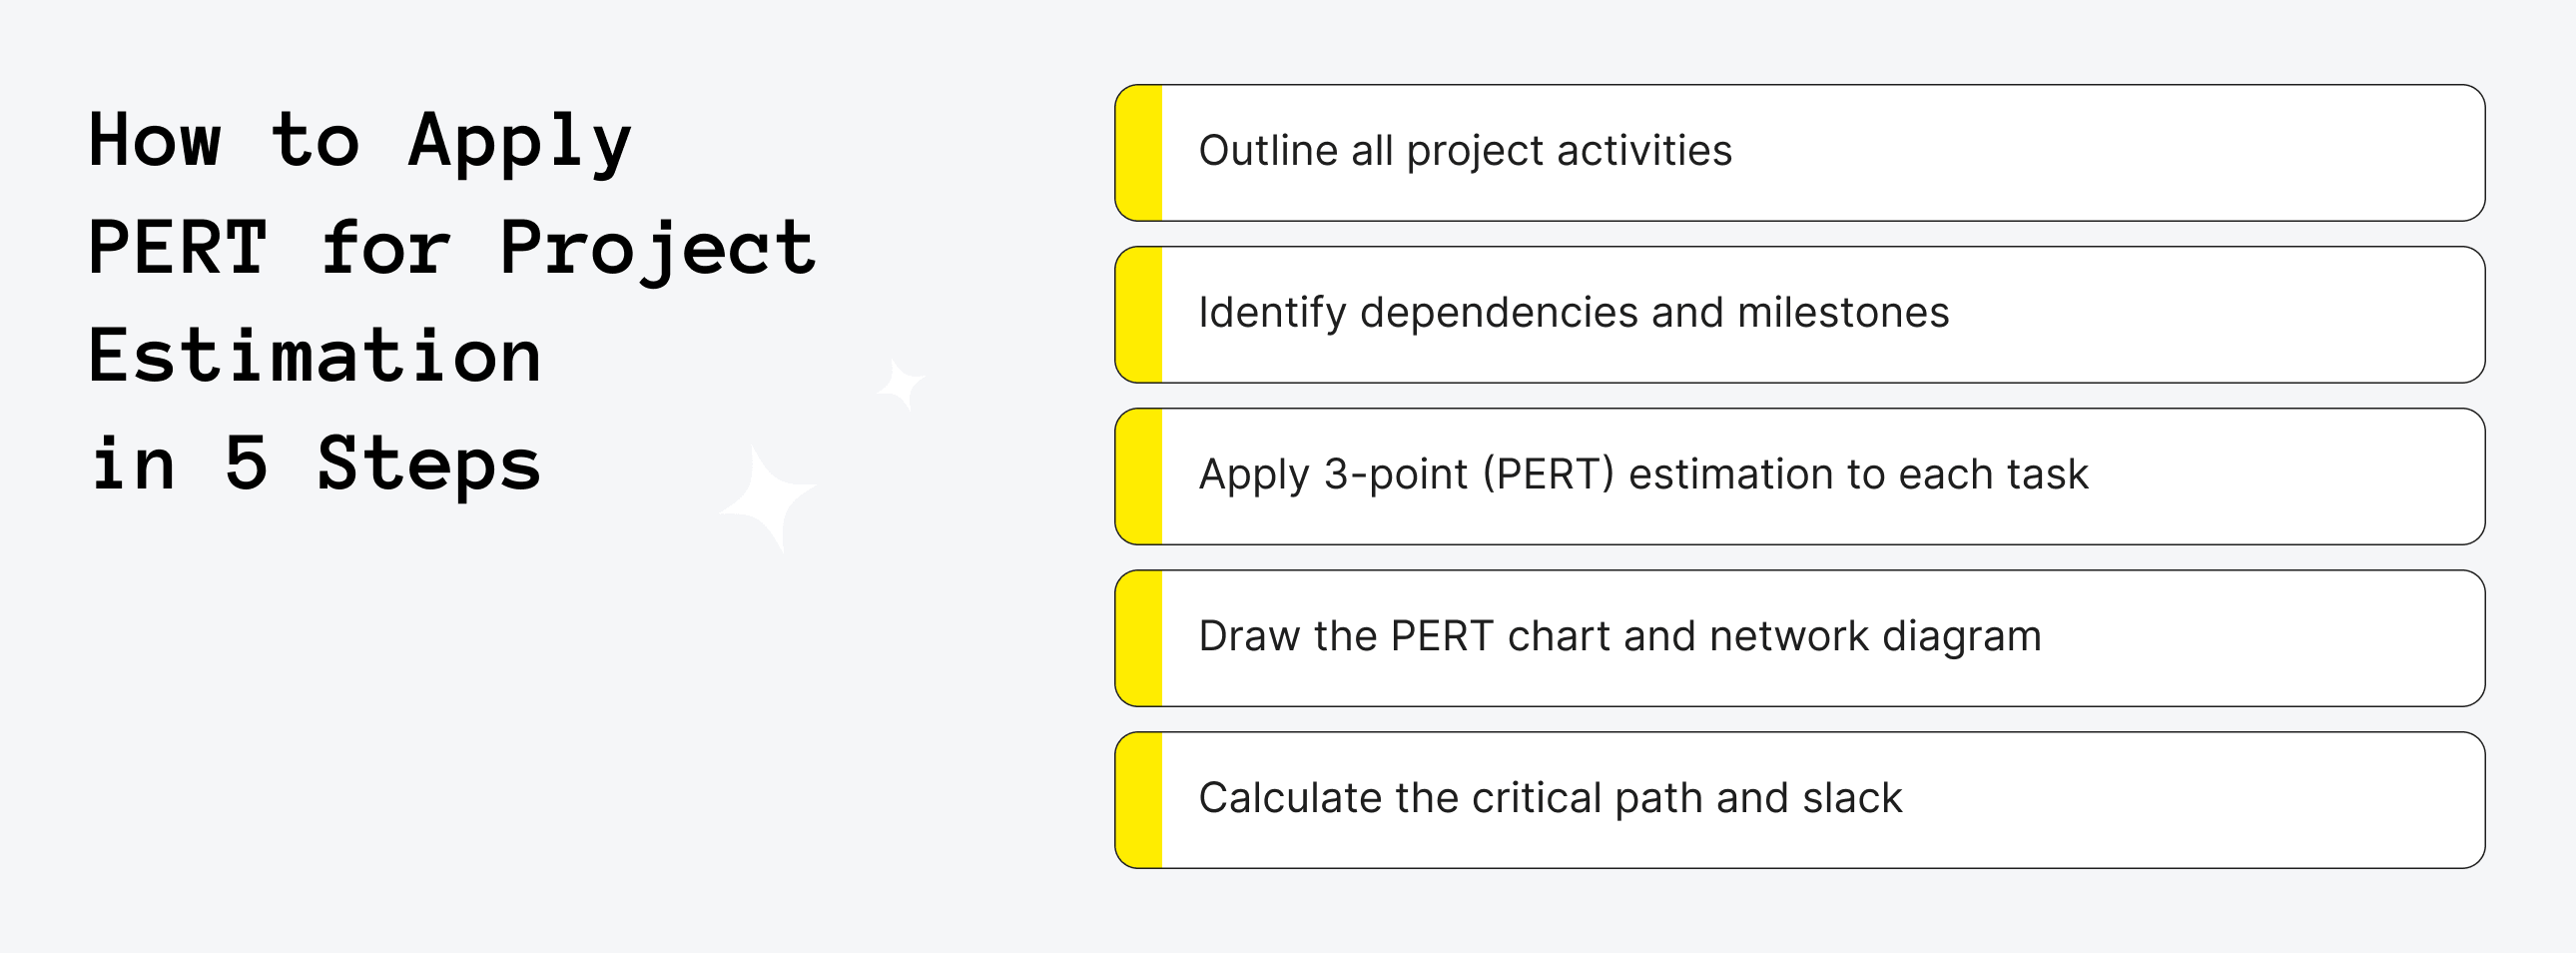
Step 1. Outline All Project Activities
It’s vital to start by splitting the project into all individual activities required to deliver the final result. Focus on concrete tasks that produce a specific outcome (for example, “create wireframes,” “set up database,” or “run usability testing”). This step is essentially about building a structured task list that covers the entire workflow from project start to completion.
Before finalizing the list, review it with the team members responsible for each area of work and confirm the planned startup tech stack. Developers, designers, and product managers can often identify missing tasks, hidden dependencies, or technical constraints that might not be obvious at first.
Step 2. Identify Dependencies and Milestones
After listing all activities, determine how tasks are connected and in what order they must be completed. In the PERT estimation technique, identifying dependencies is essential because many tasks cannot begin until others are finished. Defining these relationships helps create a realistic workflow and prevents inaccurate time estimates caused by ignoring task sequences.
At this stage, it is also helpful to align tasks with the product development roadmap and mark important milestones – key points that signal the completion of major phases or deliverables. Milestones don’t represent work themselves, but they help track progress and structure the project timeline. When dependencies and milestones are clearly defined, it becomes much easier to build the PERT network and analyze the overall schedule.
Step 3. Apply 3-Point (PERT) Estimation to Each Task
At this stage, estimate the duration of each activity using the PERT three-point estimate. Instead of assigning a single fixed timeline, the PERT method evaluates three possible scenarios: the optimistic estimate (O) for the best-case situation, the most likely estimate (M) based on normal conditions, and the pessimistic estimate (P) that accounts for potential delays or risks. This approach helps capture uncertainty and makes project estimates more realistic, which is especially important for startups trying to plan timelines while staying within a limited startup budget.
Once these three values are defined, calculate the expected task duration using the PERT formula: (O + 4M + P) / 6. The most likely estimate carries the most weight, which keeps the result balanced while still accounting for risk.
Step 4. Draw the PERT Chart and Network Diagram
Create a visual map of the project by turning your task list and dependencies into a PERT chart (network diagram). Begin by placing project activities as nodes (or boxes) and connecting them with arrows that represent dependencies. Arrange the tasks from left to right in the order they must occur, beginning with the project start and ending with the final deliverable. If multiple tasks can start after the same activity, branch them out to show parallel work.
Next, add the expected duration (calculated with the PERT estimate) to each task and make sure every dependency identified earlier is reflected in the diagram. The result should clearly show the sequence of activities, parallel paths, and points where tasks converge.
Step 5. Calculate the Critical Path and Slack
With the PERT chart complete, identify the critical path – the longest sequence of dependent tasks that determines the minimum project duration. Add up the expected durations of all tasks along each path in the network diagram; the path with the greatest total duration is the critical path.
Next, calculate slack (or float) for non-critical tasks, which shows how much a task can be delayed without affecting the overall schedule. To do this, first determine the early start (ES) and early finish (EF) for each task.
Early start is the earliest an activity can begin; it can only start when all its predecessors have finished. For the first activity, ES is always 0.
To calculate early finish, use the formula: EF = ES + TE
Then move backward through the diagram to calculate late finish (LF) and late start (LS). LF is the latest time an activity can end without delaying the project. For the last activity, LF equals its EF. For activities with multiple successors, use the smallest LS of all successors as that activity’s LF.
To calculate late start, use the formula: LS = LF − TE
Finally, calculate slack using either: Slack = LS − ES or Slack = LF − EF
If slack = 0, the task is on the critical path and cannot be delayed. If slack > 0, the task has flexibility and can be delayed by that amount without affecting the overall project timeline. This helps prioritize resources and focus on the most time-sensitive activities.

PERT Chart Example: Real-World PERT for a Software Project
In this chapter, we’ll walk through a real-world example of estimating a product — Football Odds Finder — using the PERT method, exactly as we do at Upsilon.
We’ll start by outlining the project context (product vision, target users, core value proposition, etc.) to give you a clearer understanding of what we’re building. Then we’ll show you the project estimates calculated with the PERT estimation technique. This approach helps Upsilon deliver estimates that are as accurate as possible, even when some requirements are not fully defined.
Here are a few clarifications about the estimates shown in the tables below:
- All estimates in each column are provided in days.
- Each set of estimates is calculated for a four-person development team that includes two developers (back-end and front-end), a UX/UI designer, and a project manager.
- For each milestone, feature, or user story in the tables, we provide three estimates: Optimistic (O), Most Likely (M), and Pessimistic (P). Based on these three values, we calculate the time estimate (TE column) according to the PERT technique.
Now, let’s move on to the actual project example.
Product name: Football Odds Finder
Product Vision
Create the go-to, easy-to-use web service for football bettors in England that quickly surfaces the best bookmaker odds — before kick-off and live in-play — so users can find and act on the most valuable prices.
The MVP will offer a clean, mobile-first experience showing upcoming matches, bookmaker odds (best prices highlighted), match-level detail, personal favourites, and a lightweight admin tool for odds management with a clear upgrade path to Pro features for power users and revenue via affiliate partnerships.
Target Users
- Primary: Recreational bettors who shop for the best odds and promotions before placing bets. They want a simple, trustworthy tool to compare prices quickly on their phone or desktop.
- Secondary: Serious bettors and arbitrageurs who need accurate, timely odds comparisons (including in-play) and advanced outputs (alerts, CSV/API, historical trends) that support more sophisticated workflows.
Core Value Proposition
- Speed and clarity: One glance shows which bookmaker is offering the best odds (highlighted), so users can instantly identify value across Premier League and Championship fixtures.
- Complete pre-match + live coverage: Automated updates for both pre-match and in-play markets (1-minute refresh) so users can rely on current prices when comparing or reacting to live events.
- Tailored value tiers: Free tier for quick comparisons and bookmarking; Pro tier (paid via Stripe) that adds push/email alerts, CSV export & API access, and historical odds & trend charts for advanced analysis.
- Revenue-aligned with user benefit: Freemium product drives adoption; affiliate links (you already have accounts) monetize user conversions without blocking core functionality.
- Admin control: An admin dashboard allows odds management and CSV upload to keep data accurate and editable.
MVP Scope (User-Facing Summary)
- Key pages: Homepage (matches + odds, best odds highlighted), Match details (odds per bookmaker table), Sign up/login + profile, Admin dashboard (odds entry form + CSV upload).
- Search/filters: match search and filters by league, team, date and bookmaker.
- Personalization: authentication (email/password) and favourites/bookmarking for matches and bookmakers.
- Markets shown at launch: Full-time result (1X2), Over/Under 2.5, Both Teams To Score (BTTS), Correct score.
- Odds sourcing: automated-only updates; direct API access for Bet365, William Hill and Betfair; a licensed third-party odds provider will provide the remaining Top UK bookmakers’ feeds.
- Update cadence: 1-minute refresh for pre-match and in-play for all users; Pro tier does not receive faster updates at launch.
- Monetization: Freemium + affiliate program; single Pro subscription plan processed via Stripe (pricing to be decided).
Project PERT Estimates (all done in days; 4-person team/1 day)
Milestone 1: Core Odds and UX (MVP)
Milestone 2: Admin and Odds Feeds (MVP)
Milestone 3: Accounts, Monetization and Analytics (MVP)
High‑level PERT TE by milestone
Milestone 1: Core Odds and UX
Milestone 2: Admin and Odds Feeds
Milestone 3: Accounts, Monetization and Analytics
MVP Total TE = 39.0 + 60.0 + 38.0 ≈ 137.0 days


PERT vs CPM vs Gantt Charts
PERT (Program Evaluation and Review Technique) is a project management method focused on handling uncertainty and estimating task durations using three-point estimates – optimistic, most likely, and pessimistic. It emphasizes analyzing task dependencies and identifying the critical path, which determines the minimum project duration. PERT is ideal for projects where timelines are uncertain or tasks vary significantly, making it a strong tool for risk assessment and schedule planning.
CPM (Critical Path Method), in contrast, assumes known, fixed task durations and is best for projects with predictable and repetitive tasks. The difference between PERT and CPM in project scheduling lies in how each method treats uncertainty: PERT produces probabilistic timelines to account for variability, while CPM generates a deterministic schedule based on fixed durations. Understanding CPM vs PERT helps project managers choose the right method based on whether task durations are uncertain or fixed, ensuring efficient scheduling and resource allocation.
For software development, understanding the PERT vs Gantt chart for software project planning is equally important. Gantt Charts provide a visual timeline of project tasks, showing start and end dates along a calendar. Unlike PERT, Gantt charts do not explicitly highlight the critical path or account for uncertainty, but they excel at progress tracking and schedule communication. Comparing PERT vs Gantt, it’s clear that PERT is stronger for planning and estimating, while Gantt charts are better for visualizing timelines and monitoring execution. Check out a detailed comparison table below, outlining the main differences between PERT, CPM, and Gantt charts.
Advantages and Disadvantages of PERT in Project Management
The Program Evaluation and Review Technique (PERT) provides a structured framework for planning and scheduling projects, especially when timelines are uncertain or projects are complex. By incorporating three time estimates (optimistic, most likely, and pessimistic), PERT allows project managers to create more realistic schedules and anticipate potential delays.

Key benefits of PERT in project management include:
- More accurate time estimates: Using three-point estimates ensures that both best-case and worst-case scenarios are considered, giving a balanced view of project duration.
- Identification of critical tasks: PERT highlights tasks that directly influence the overall project timeline, helping managers focus on activities that could cause delays.
- Enhanced decision-making: The method provides quantitative data for evaluating alternative scenarios and planning contingencies.
- Clear visualization of dependencies: Network diagrams show how tasks relate to one another and in what sequence they should be performed.
- Better planning for complex projects: PERT is particularly valuable for large projects or projects with uncertain task durations, where traditional linear scheduling may fall short.
- Proactive risk management: By anticipating potential delays, PERT encourages early identification of risks and the development of mitigation strategies.
Overall, PERT helps teams navigate uncertainty, allocate resources wisely, and maintain a focus on the most time-sensitive tasks.
Despite its strengths, PERT also has limitations that can affect its effectiveness:
- Time-intensive: Building and maintaining PERT charts, especially for large projects with many tasks, can require significant effort.
- Dependent on accurate estimates: The reliability of PERT depends heavily on the quality of time estimates; poor or subjective data can undermine the schedule.
- Potentially overly complex: For smaller projects or projects with well-known durations, PERT may introduce unnecessary complexity.
- Limited focus on resources: Traditional PERT emphasizes timing and task dependencies, often overlooking resource availability, costs, or personnel constraints.
- Static representation: Standard PERT charts are not easily updated for real-time changes without dedicated project management software.
- Risk of misinterpretation: Without a solid understanding of the methodology, users may misread dependencies or critical paths, leading to flawed planning decisions.
In short, PERT is most effective for projects where uncertainty and interdependent tasks are significant, but it may be less practical for small, straightforward projects or when precise data is unavailable.
When Startups Should Use PERT in Project Management
Startups operate in environments full of uncertainty, especially when developing new products or exploring untested technologies. PERT is valuable because it accounts for unpredictability in task durations, allowing teams to plan realistic timelines even when exact estimates are impossible. By providing a structured framework for managing uncertainty, it helps founders anticipate delays, identify risks early, and make informed decisions before problems arise.
Another major advantage is improved communication with investors, stakeholders, and internal teams. PERT allows startups to present timelines that clearly highlight critical tasks and potential bottlenecks. This transparency is especially valuable when pitching to investors, as it shows that the team understands potential risks and has a structured plan to manage them.
From a resource perspective, PERT optimizes allocation and prioritization. By identifying the critical path and tasks with slack, startups can focus limited resources on activities that directly impact project completion, while less urgent tasks can be scheduled flexibly. This ensures that teams are working efficiently, reducing wasted effort and avoiding delays that could derail the project.
Typical use cases for startups include:
- Projects where task durations are genuinely unknown, such as experimental R&D initiatives.
- New product development involving unfamiliar technologies or processes, including MVP development.
- Complex multi-phase projects with many interdependent tasks.
In these scenarios, PERT helps startups manage uncertainty, plan with awareness of risks, allocate resources efficiently, and increase the reliability of project delivery.
Need a hand with your product idea?
Upsilon was once a startup too, so we can help build and scale your product!
Conclusion: Is PERT Right for Your Next Project?
The PERT estimation technique is a powerful tool for startups and teams tackling uncertainty. It helps break complex projects into manageable tasks, accounts for variable task durations, and highlights the critical path, enabling more realistic timelines, better resource allocation, and proactive risk management. For projects with interdependent tasks, experimental processes, or new technologies, PERT provides a structured approach that transforms uncertainty into actionable planning.
MVP development, in particular, benefits from combining PERT with disciplined execution. By starting small, focusing on useful features, and iterating based on real-world feedback, teams can avoid wasted effort and create early products that truly meet user needs. Whether you’re testing a new platform, launching a feature, or managing a multi-phase project, this approach ensures early versions are testable, manageable, and aligned with priorities.
For startups seeking expert guidance, we at Upsilon offer professional MVP development services. Our team helps turn your ideas into functional, flexible MVPs while supporting you with planning, prioritization, and feedback loops. With the right strategy and execution, combining PERT with structured MVP development can give your project the clarity, focus, and efficiency it needs to succeed. Feel free to contact us if you have any questions – we’re here to help!
FAQs
1. How can startups combine PERT with Agile or Scrum?
Startups can combine PERT with Agile or Scrum by using PERT to plan high-level timelines and identify critical tasks, while Agile manages day-to-day sprints and iterative development. PERT provides a probabilistic view of project duration, which complements Scrum’s flexible backlog prioritization. Teams can use PERT to anticipate risks and bottlenecks, then adjust sprint goals accordingly. This hybrid approach ensures structured planning without limiting Agile’s adaptability.
2. What are the three types of PERT estimates?
The three types of PERT estimates are:
- optimistic (represents the best-case scenario);
- most likely (reflects the expected duration based on experience);
- pessimistic (accounts for potential delays or complications).
These three points are used to calculate an expected duration for each task. By considering all three, PERT captures uncertainty and creates a more realistic project timeline. This method helps teams prepare for variability rather than relying on a single fixed estimate.
3. How accurate is PERT compared to other estimation methods?
PERT offers greater flexibility than traditional single-point estimation methods because it accounts for uncertainty and evaluates multiple possible scenarios. Its reliability, however, depends on the accuracy of the input estimates. If the data is poor, the results can be misleading.
Unlike CPM, which relies on fixed task durations, PERT generates a probabilistic range of possible completion times rather than a single deterministic schedule. In general, PERT provides a more realistic outlook for projects with unpredictable or variable task lengths, but it may be less precise when task durations are already well-defined.
4. What software tools support PERT chart creation?
Several project management tools support PERT chart creation, including Microsoft Project, Smartsheet, Lucidchart, and Wrike. Many of these tools allow users to define tasks, dependencies, and durations, then automatically generate network diagrams. Some platforms integrate probabilistic calculations for expected task durations based on three-point estimates. These tools make it easier to visualize critical paths and manage complex project schedules efficiently.
5. Is PERT suitable for estimating an MVP?
Yes, PERT is suitable for estimating an MVP because MVP development often involves uncertainty in task durations and untested processes. PERT helps identify critical tasks, potential bottlenecks, and realistic timelines for early iterations. It allows teams to plan with a range of possible outcomes, which is crucial for managing risk in experimental projects. Using PERT alongside focused MVP planning ensures the product is delivered efficiently while remaining adaptable to feedback.


to top


-2.png)